IELTS Table: Activities 1-4
ACTIVITY 1
In IELTS Writing Task 1 you may be asked to describe data given in a table. Before you begin writing, take a few minutes to ‘read’ and understand the table. Think about the following:
- Read the instructions carefully these will tell you what the table shows.
- Does the table have a title? If it does, read it carefully so that you know what the table is
- Is the table static or dynamic? Static tables show data at one point in time; dynamic tables
- show how data changes over time. This will affect the language you use in your description.
- What do the columns and rows represent?
- What unit of measurement does each cell represent? Kilometres, euros, litres…??
- Be clear about what the table does not show!
Read this IELTS task and then decide whether the statements which follow are true or false or if it is impossible to tell from the data. Choose T / F or Im
Questions:
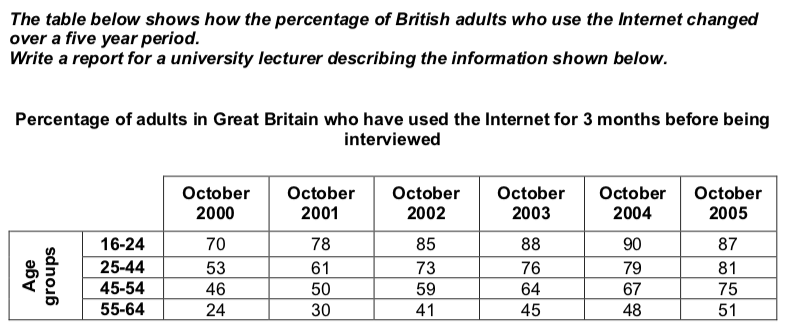
1 The table shows the number of people in Great Britain who use the Internet. ____
2 The table shows the percentage of people in Great Britain who used the Internet between July and October each year. ____
3 The table shows change over time (dynamic). ____
4 In October 2000, more 16 to 24 year olds used the Internet than 25 to 44 year olds. ____
5 The lowest percentage of Internet use is with the 55 to 64 year olds. ____
6 In October 2004, only forty eight 55 to 64 year olds used the Internet. ____
7 10 per cent of 16-24 year olds didn’t use the Internet in October 2004. ____
8 The percentage of people in Great Britain who used the Internet increased over the five years. ____
1 The table shows the number of people in Great Britain who use the Internet. [F]
2 The table shows the percentage of people in Great Britain who used the Internet between July and October each year. [F]
3 The table shows change over time (dynamic). [T]
4 In October 2000, more 16 to 24 year olds used the Internet than 25 to 44 year olds. [T]
5 The lowest percentage of Internet use is with the 55 to 64 year olds. [T]
6 In October 2004, only forty eight 55 to 64 year olds used the Internet. [T]
7 10 per cent of 16-24 year olds didn’t use the Internet in October 2004. [T]
8 The percentage of people in Great Britain who used the Internet increased over the five years. [Im]
ACTIVITY 2: Ways of Expressing Numbers
There are a number of different ways of expressing the same figure in English. For example, we can say ‘a half’, ‘one in two’ or ‘fifty per cent’ and they all mean the same. It’s a good idea to vary the way you express figures in your description of the table or chart. All the phrases below can be used to describe figures. Group them into phrases which mean the same.
a fifth
a quarter
a tenth
a third
just over sixty per cent
just over thirty per cent
one in five
one in four
one in ten
one in three
seventy five per cent
ten per cent
three out of four
three quarters
twenty five per cent
twenty per cent
two out of three
two thirds
- a fifth, one in five, twenty per cent
- a quarter, one in four, twenty five per cent
- a tenth, one in ten, ten per cent
- a third, one in three, just over thirty per cent
- three out of four, three quarters, seventy five per cent
- two out of three, two thirds, just over sixty per cent
16-24 year olds had the greatest Internet usage. In 2004, for example, 1 ___ out of ten people in this age group used the Internet.
In 2001 just over 2 ___ of 25-44 year olds used the Internet. Two years later, the figure was just over 3 ___.
For the 45-54 age group, Internet usage rose from just under 4 ___ in 2000 to 5 ___ in 2005.
In 2000, only one in 6 ___ 55-64 year olds used the Internet. This figure had risen to over 7 ___ by 2005.
16-24 year olds had the greatest Internet usage. In 2004, for example, 1 [nine] out of ten people in this age group used the Internet.
In 2001 just over 2 [sixty per cent] of 25-44 year olds used the Internet. Two years later, the figure was just over 3 [seventy per cent].
For the 45-54 age group, Internet usage rose from just under 4 [fifty per cent] in 2000 to 5 [three quarters] in 2005.
In 2000, only one in 6 [four] 55-64 year olds used the Internet. This figure had risen to over 7 [fifty per cent] by 2005.
ACTIVITY 4: Using Quantifiers
In Part 1 of the writing test you may have to describe amounts. You’ll need to be careful using quantifiers words like ‘much’, ‘many’, ‘some’ etc. Put the words and expressions below into the correct group.
a large amount
a little
a lot of
a small amount
a small number
few
fewer
fewer and fewer
less
less and less
many
more
most
much
no
none of
several
the majority of
Used with countable nouns (men, women, cars, hours etc):
- a small amount
- a small number
- few
- fewer
- fewer and fewer
- many
- most
- none of
- several
Used with uncountable nouns (time, money, water etc)
- a large amount
- a little
Used with both countable and uncountable nouns
- a lot of
- less
- less and less
- more
- much
- no
- the majority of
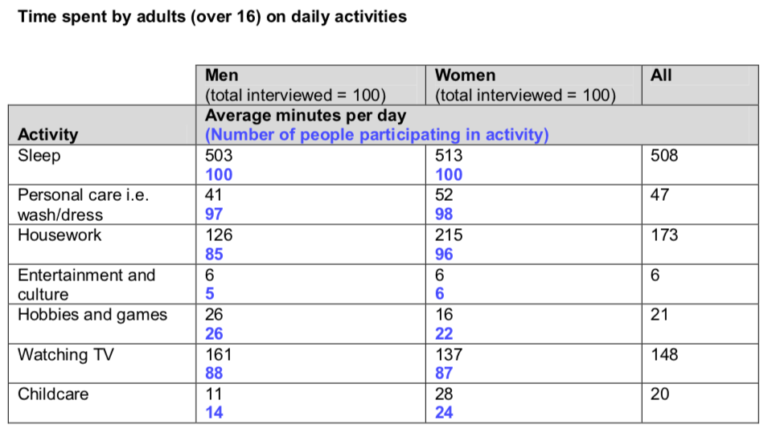
The table shows how 1 ___ [much/many] time people spend on certain daily activities. Not surprisingly, everybody surveyed spent 2 ___ [a lot of/many] time sleeping. However, men spent slightly 3 ___ [fewer/less] time sleeping than women did. After sleeping, the next most time consuming activity was housework, taking up 178 minutes per day, on average. Again, though, there was a marked difference between men and women, with women spending 4 ___ [many/much] more minutes per day on this activity than men. In addition, a greater 5 ___ [amount/number] of women than men reported that they spent time on housework and childcare. In contrast, men spent a greater 6 ___ [amount/number] of time on their hobbies and games than women did. Very 7 ___ [few/many] people surveyed spent much free time on entertainment and culture. For the 8 ___ [majority/most] of people, free time was spent watching television. Almost nine out of ten people reported that they spent 9 ___ [several/lots] hours watching TV every day.
The table shows how 1 [much] time people spend on certain daily activities. Not surprisingly, everybody surveyed spent 2 [a lot of] time sleeping. However, men spent slightly 3 [less] time sleeping than women did. After sleeping, the next most time consuming activity was housework, taking up 178 minutes per day, on average. Again, though, there was a marked difference between men and women, with women spending 4 [many] more minutes per day on this activity than men. In addition, a greater 5 [number] of women than men reported that they spent time on housework and childcare. In contrast, men spent a greater 6 [amount] of time on their hobbies and games than women did. Very 7 [few] people surveyed spent much free time on entertainment and culture. For the 8 [majority] of people, free time was spent watching television. Almost nine out of ten people reported that they spent 9 [several] hours watching TV every day.