Understanding the Question
TYPES OF QUESTIONS
You will be presented with one of the following graphics:
- Bar Chart
- Line Graph
- Table Chart
- Pie Chart
- Process Diagram
- Map
- Multiple Graphs
You are required to write a short report about the main features. For example, you may be asked to:
- summarise data
- describe the stages of a process
- explain how something works
- describe an object or event
The format of the question will always be the same. It will include:
- A brief description of the graphic
- The instructions
- The graphic – chart, graph, table, etc.
Now, we’re going to look briefly at the different type of questions for IELTS Academic Writing Task 1 and a sample question for each.
BAR CHART
The bar chart below shows numbers of seals, whales and dolphins recorded in the Gormez Straits from 2006 to 2018.
Summarise the information by selecting and reporting the main features, and make comparisons where relevant.
Write at least 150 words.

LINE GRAPH
The graph below shows the population for India and China since the year 2000 and predicts population growth until 2050.
Summarise the information by selecting and reporting the main features, and make comparisons where relevant.
Write at least 150 words.

TABLE
The tables below give information about the world population and distribution in 1950 and 2000, with an estimate of the situation in 2050.
Summarise the information by selecting and reporting the main features, and make comparisons where relevant.
Write at least 150 words.

PIE CHART
The chart below shows the reasons why people travel to work by bicycle or by car.
Summarise the information by selecting and reporting the main features, and make comparisons where relevant.
Write at least 150 words.

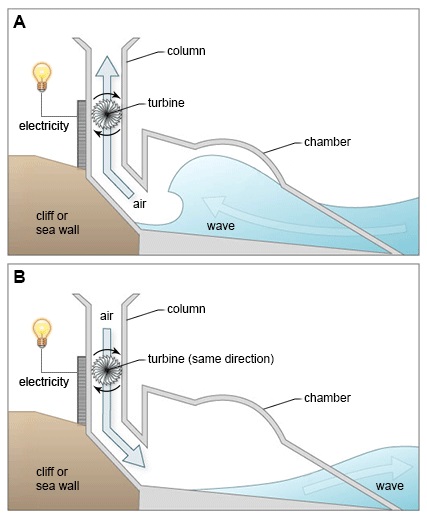
PROCESS DIAGRAM
The diagrams below show a structure that is used to generate electricity from wave power.
Summarise the information by selecting and reporting the main features, and make comparisons where relevant.
Write at least 150 words.
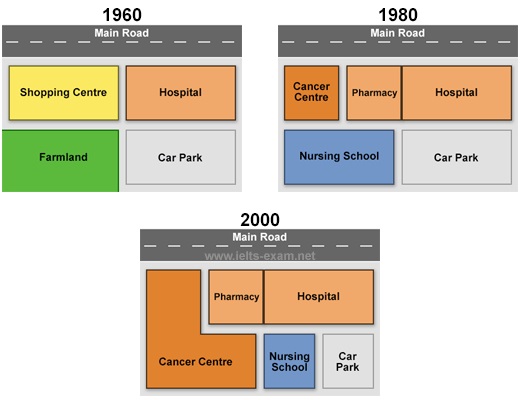
MAP
The diagrams below show the changes that have taken place at Queen Mary Hospital since its construction in 1960.
Summarise the information by selecting and reporting the main features, and make comparisons where relevant.
Write at least 150 words.
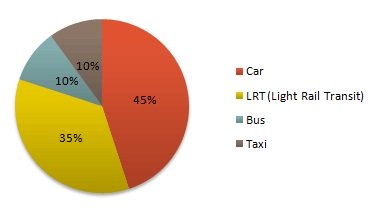
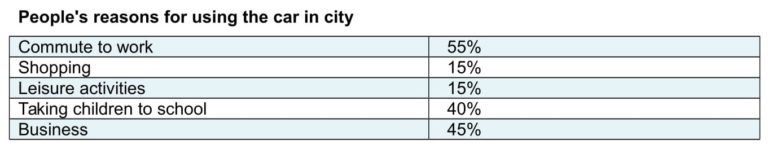
MULTIPLE GRAPHS
The diagrams below give information on transport and car use in Edmonton.
Summarise the information by selecting and reporting the main features, and make comparisons where relevant.
Write at least 150 words.
STEPS TO WRITING A GOOD ANSWER
There are 5 steps to writing a good essay for IELTS Academic Writing Task 1:
- Analyse the question
- Identify the main features
- Write an introduction
- Write an overview
- Write the details paragraphs
One of the biggest mistakes many students make is missing out the first step – analysing the question. They are so worried about getting their essay finished in 20 minutes that they get straight down to writing without fully understanding the question. The result is an essay that fails to meet many of the marking criteria and thus achieves a low score.
Even though your language skills may be good enough to earn you a Band 7 or 8, not answering the question appropriately could reduce your score to a Band 6 or even lower. It’s not difficult to analyse and understand task 1 questions once you know how and that’s what you’re going to learn in this lesson.
UNDERSTANDING THE QUESTION
The bar chart below shows numbers of seals, whales and dolphins recorded in the Gormez Straits from 2006 to 2018.
Summarise the information by selecting and reporting the main features, and make comparisons where relevant.
Every question consists of:
- A brief description of the graphic
- The instruction
- The graphic – chart, graph, table, etc.
So, let’s analyse what you have to do. For this, we need to look at the ‘instruction’ sentence.
Summarise the information by selecting and reporting the main features, and make comparisons where relevant.
You have to do 3 things:
- Select the main features.
- Write about the main features.
- Compare the main features.
This is same for every question and every type of graphic. You’ll notice that each part of the task refers to the ‘main features’ of the graphic. You do not have to write about everything. You don’t need to give a reason for the trend.
A key skill you must learn is how to quickly pick out the features.
Another point to note is that you are not required to give your opinion as you would for many Task 2 essays. This is a common mistake which will lose you marks. Only write about what you can see in the graphic.
Identifying the Main Features
We’re now going to give you some checklists to help you to identify the main features of the different types of IELTS Academic Writing Task 1 questions. We will go into detail on how to pick out the main features in specific questions in the next lesson and when we cover individual question types.
The various types of graphs and charts are not especially difficult to interpret. The challenge for most students is simply that they are not used to working with them. Remember, IELTS is an English exam designed to test your language skills, not your mathematics ability. No complicated calculations are required. The graphics are just a way of presenting information using numbers and diagrams. Your job is to convert the information into a written form. That’s all you have to do.