Horizontal Bar Chart

Sample Answer
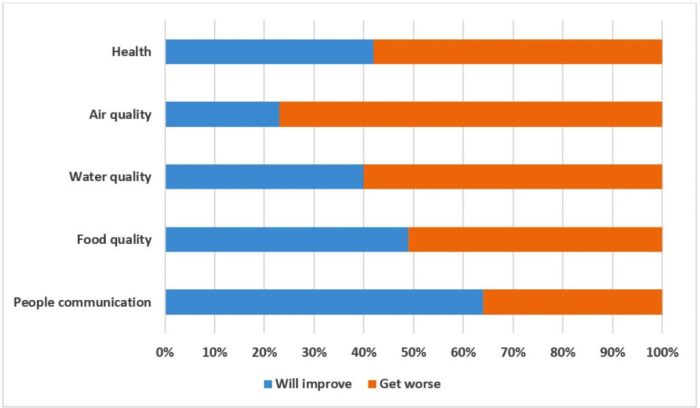
The graph illustrates young people’s expectations for change in five different aspects of European life over the next 20 years.
Overall, the majority of the surveyed youth expect that, besides the communication between people, all other surveyed aspects of life will get worse.
Looking at the graph in more detail, it can be seen that 77% of people surveyed expected to see a decline in air quality, which was over three times more than the number of people who believed otherwise. Similarly, over half of the surveyed youth believed that the quality of health, as well as water, would decline over the next 20 years, with the figures being 58% and 60% respectively.
In contrast, the majority of people participating in the survey expected to see improvements in the communication between people, at 64%, while only 36% of them thought the opposite. Meanwhile, opinions on food quality were divided almost equally with just over half the survey participants believing that things would improve, and 49% thinking the opposite.

Sample Answer
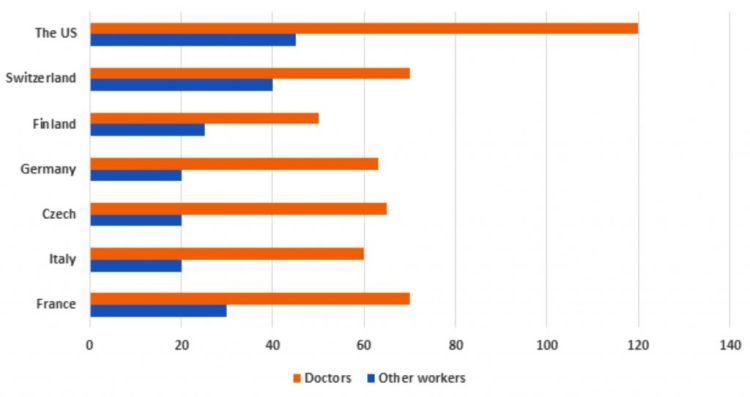
The bar chart compares seven countries regarding the yearly payment for doctors and other jobs in the year 2004.
It is clear that doctors generally made more money than other types of work in each country during the research period. Also, the average incomes of American doctors and other workers were the highest among the seven nations.
The US doctors earned the largest amount of money compared to those in the other six countries, receiving nearly $120,000, while the figures for Switzerland and France were significantly lower, at close to 70,000 each. In contrast, there was only about $50,000 earned by doctors in Finland, as opposed to doctors in the other countries, who received around $61,000 each.
Regarding the average salaries of other workers, the amount of money earned by other workers in the US, at approximately $45,000 and in Switzerland, at exactly $40,000 was higher than in any of the other nations. Roughly $30,000 was given to French other workers, about $5,000 higher than that of Finnish counterparts. By contrast, the figures for the remaining countries were lowest, at exactly $20,000 each.

Sample Answer
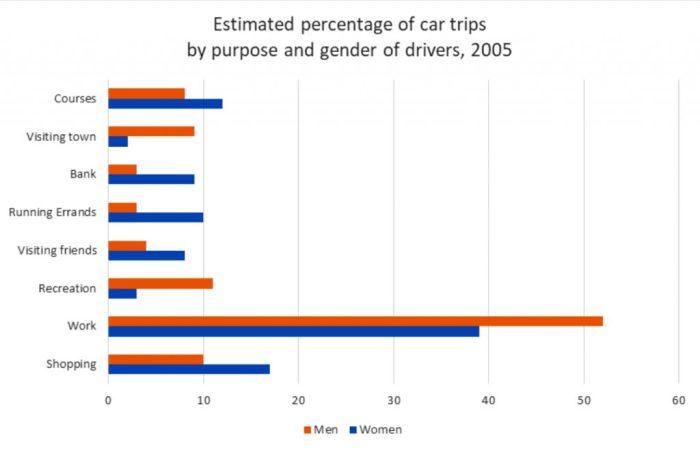
The bar chart compares the percentage of car trips made by male and female drivers for eight different purposes in 2005.
It can be seen that commuting to work was the most common reason for car travel for both males and females. Meanwhile, visiting town, recreation, going to the bank, running errands, and visiting friends were the reasons for car travel that saw the biggest difference between the percentages of men and women doing these activities.
In 2005, 52% of men travelled to work by car, which was about 13% higher than that of women for the same purpose. By contrast, slightly more women than men went on car trips for shopping, with 16% and 10%, respectively. Similarly, the percentages of men and women driving to courses were fairly similar, at 8% and 12% respectively.
The percentage of each gender was considerably different with regards to other purposes. The percentage of men who made car trips to visit town, at 9%, and for recreation, at 11%, were nearly three times more than that of women for each purpose. While cars were used by around 8% to 10% of women for going to the bank, running errands, and visiting friends, approximately 4% of men used a car for the same purpose.
